Introducing Total Virus
The Virus Total website is a well-known service by the cybersecurity team for allowing you to track various IoCs (Indicators of Compromissed) such as file hash, IP, domain or URL based on a simple search.
Virus Total has a subscription modality where it is free and has limits for consultations, in order to avoid its use by bots or third-party systems.See the details below and note that we have our API Key here even though it is a free account:

Solution on Sentinel
Since we have the possibility to integrate Virus Total data with Sentinel alerts and incidents, the first action is to install the Solution:

When installing the solution, you will see the information screen on the left that includes 9 playbooks that will collect incident, alert, domain or file data to search and correlate Sentinel data with Virus Total.The next step is to click on
Automation –> Playbook templates and install the playbooks, for this you can filter by the word “total virus” and use the
Create Template button to open the playbook installation window in your environment:

On this screen you will see that it is not yet necessary to connect your API Key or Log Analytics, this will be done after the
deploy when it opens the Logic Apps design screen:

Note that when opening the Logic Apps tasks and sequence you will see that the Virus Total and LogAnalytics connection will have the warning symbol and the save button will not work until you fix the connections.For this, the first time you will need to click on
API Connections and inform the data of both Virus Total and Log Analaytics that will be used. Below is the example of connection with Virus Total:

In the next connectors you will no longer need to configure the connections, as it will allow you to use the connection already configured in previous playbooks, like the image below:

Remember that you will need to connect both the Virus Total and Log Analytics API (workspace ID and Key).Once configured, now after opening all the tasks and indicating the connections you will be able to save the Logic Apps and you will see that it will appear in the
Active playbooks tab :

Creating the Automation
Now that we’ve imported the solution and created the playbooks we want to use, the next step is to create the rule to run it, called an
Automation Rule .To do so, click on the
Create button –
-> Automation Rule and indicate the name of the rule and the trigger (trigger), which can be a new incident, a changed incident or a new alert.
When choosing the type of trigger, use the Run Playbook action to choose one of the triggers we created in the previous step:


When creating the rule there are several forms of filters that you can use, for example to detect that there is a file that will be analyzed since one of the playbooks is specific for hashing. You can also filter only for certain types of incidents or alerts.
Conclusion
Integrating different services to have IoCs from different sources will help a lot in your incident analysis.Also being tested right now in private preview widgets to bring data from Anomali, Record Future and Virus Total when you are investigating an entity (Entity) but that is another post in the future 🙌
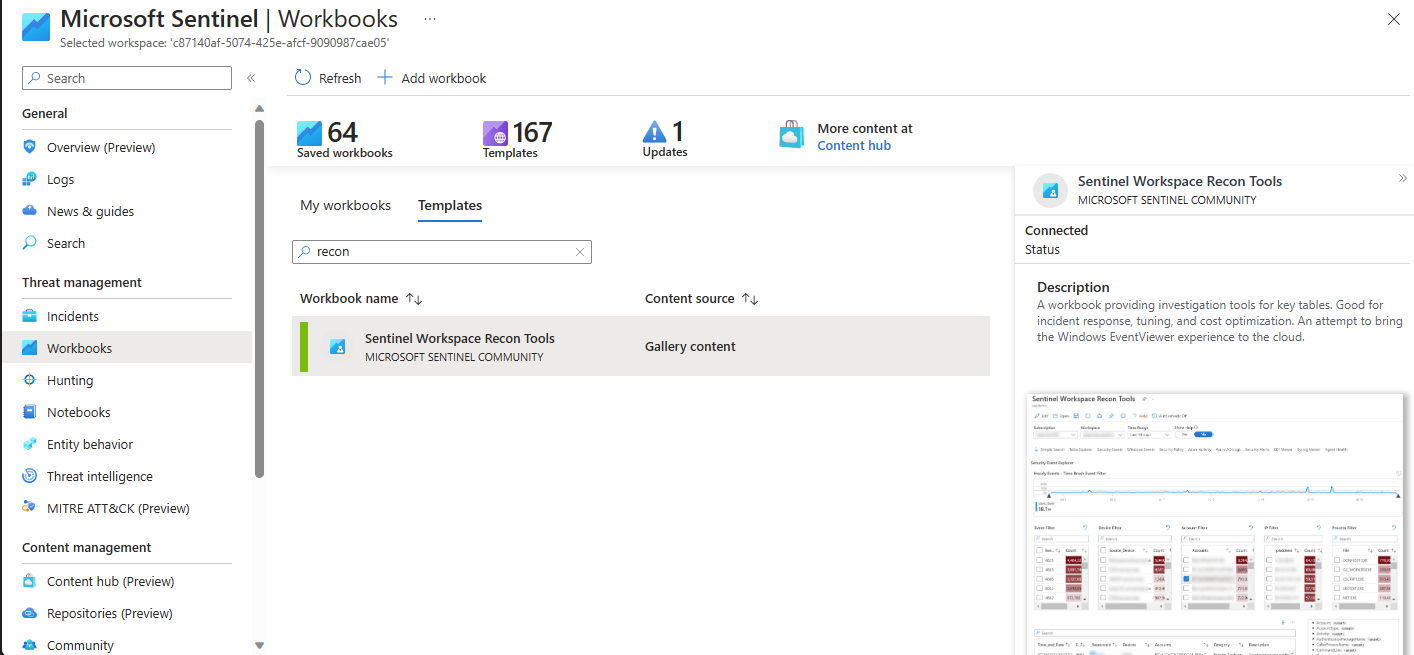
We know that Microsoft Sentinel is a tool to capture, analyze and generate security insights for operations and SOC.Since we have thousands of signals and events inside Sentinel, we can analyze different situations with its use.We are going to approach here a Workbook that is in the gallery of the community that has the name Sentinel Recon whose function is to allow intelligent research of the collected data.
Installing the Workbook
The first step is to search for and save the template in your environment. Search with the name “Recon” in Templates as below:
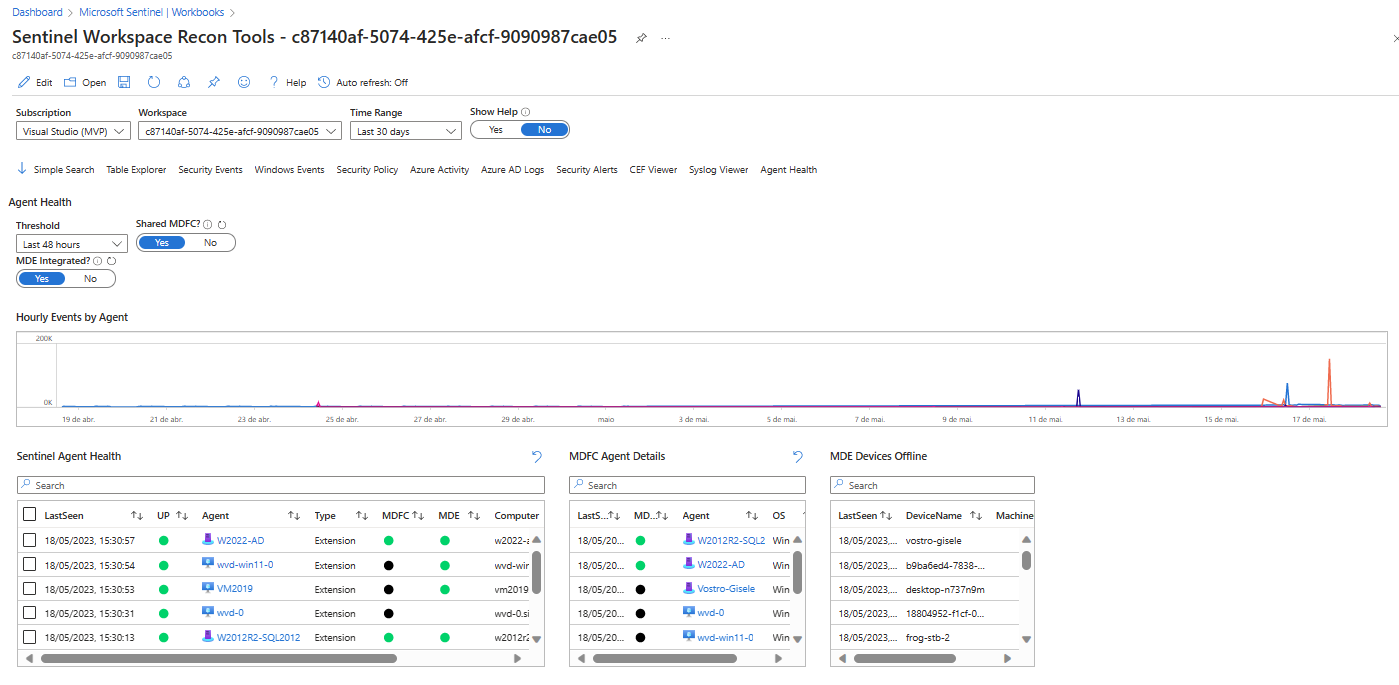
Using the Workbook
Once open, use it from the “My workbooks” tab. Configure the Azure subscription where your Log Analytics that supports Sentinel resides, and include the desired polling period. Obviously, the longer the period, the slower it will be to return data and depending on the size of the environment, a timeout error may occur.In the example below I used Recon to validate the agents I have installed, both native and Arc, where it gives me a view of the data ingestion and allows me to filter what I want to analyze in the detail tables:
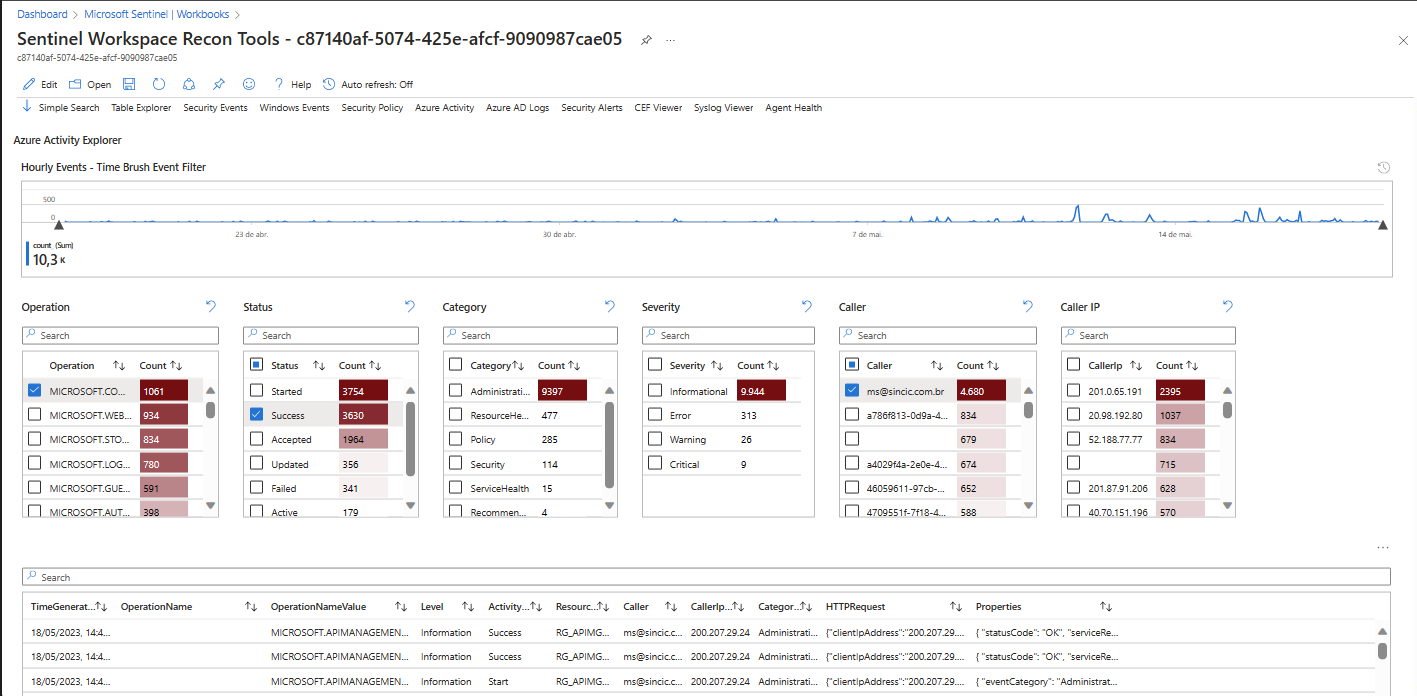
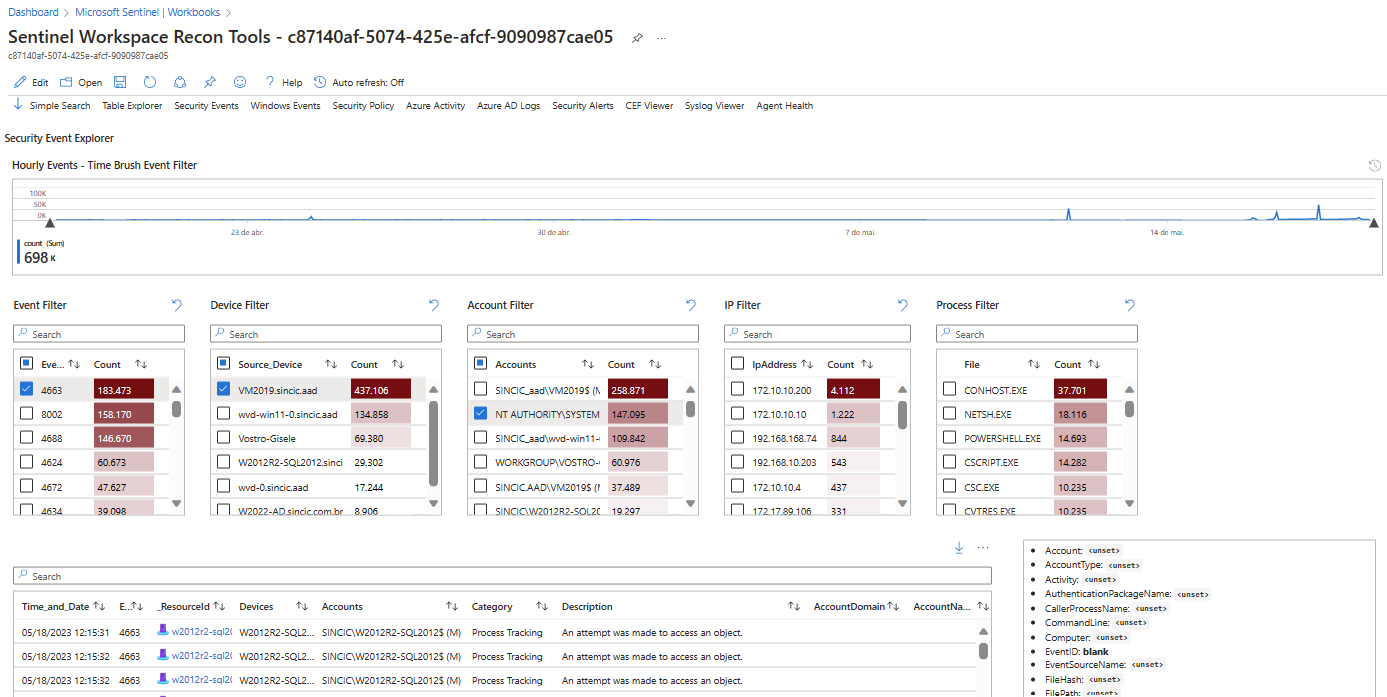
Another research that returned interesting data is using the resources “Azure Activity” and “Security Events” where, as in the previous example, I now have a view of the flow of events ingested by Sentinel and I used some filters to know the specific origin of certain events and activities:
Conclusion
Use this workbook in conjunction with Sentinel to easily and intelligently drill down and discover details of what is being analyzed and ingested.
In April of this year, with the launch of the System Center 2022 suite, I wrote whether the products were still important and their counterparts in services and solutions on Azure System Center 2022 Launch – Still Worth It? Will it be discontinued? | Marcelo Sincic [MVP] (wordpress.com)
One of these products was System Center Operations Manager (SCOM) which has always been a very important tool in monitoring on-premise environments.
As already discussed in April, the use of Azure Arc and Azure Monitor can be used for on-premise environments but depend on the internet, generating corresponding alerts written in KQL and consuming credits with the massive ingestion of events from the log.
For example, a rule built in SCOM where we relate the log of one server to another using a sequential Event ID to indicate a break chain or else a map with related objects is much more complicated to be built in Azure Monitor requiring knowledge of Jupyter Notebooks and KQL.
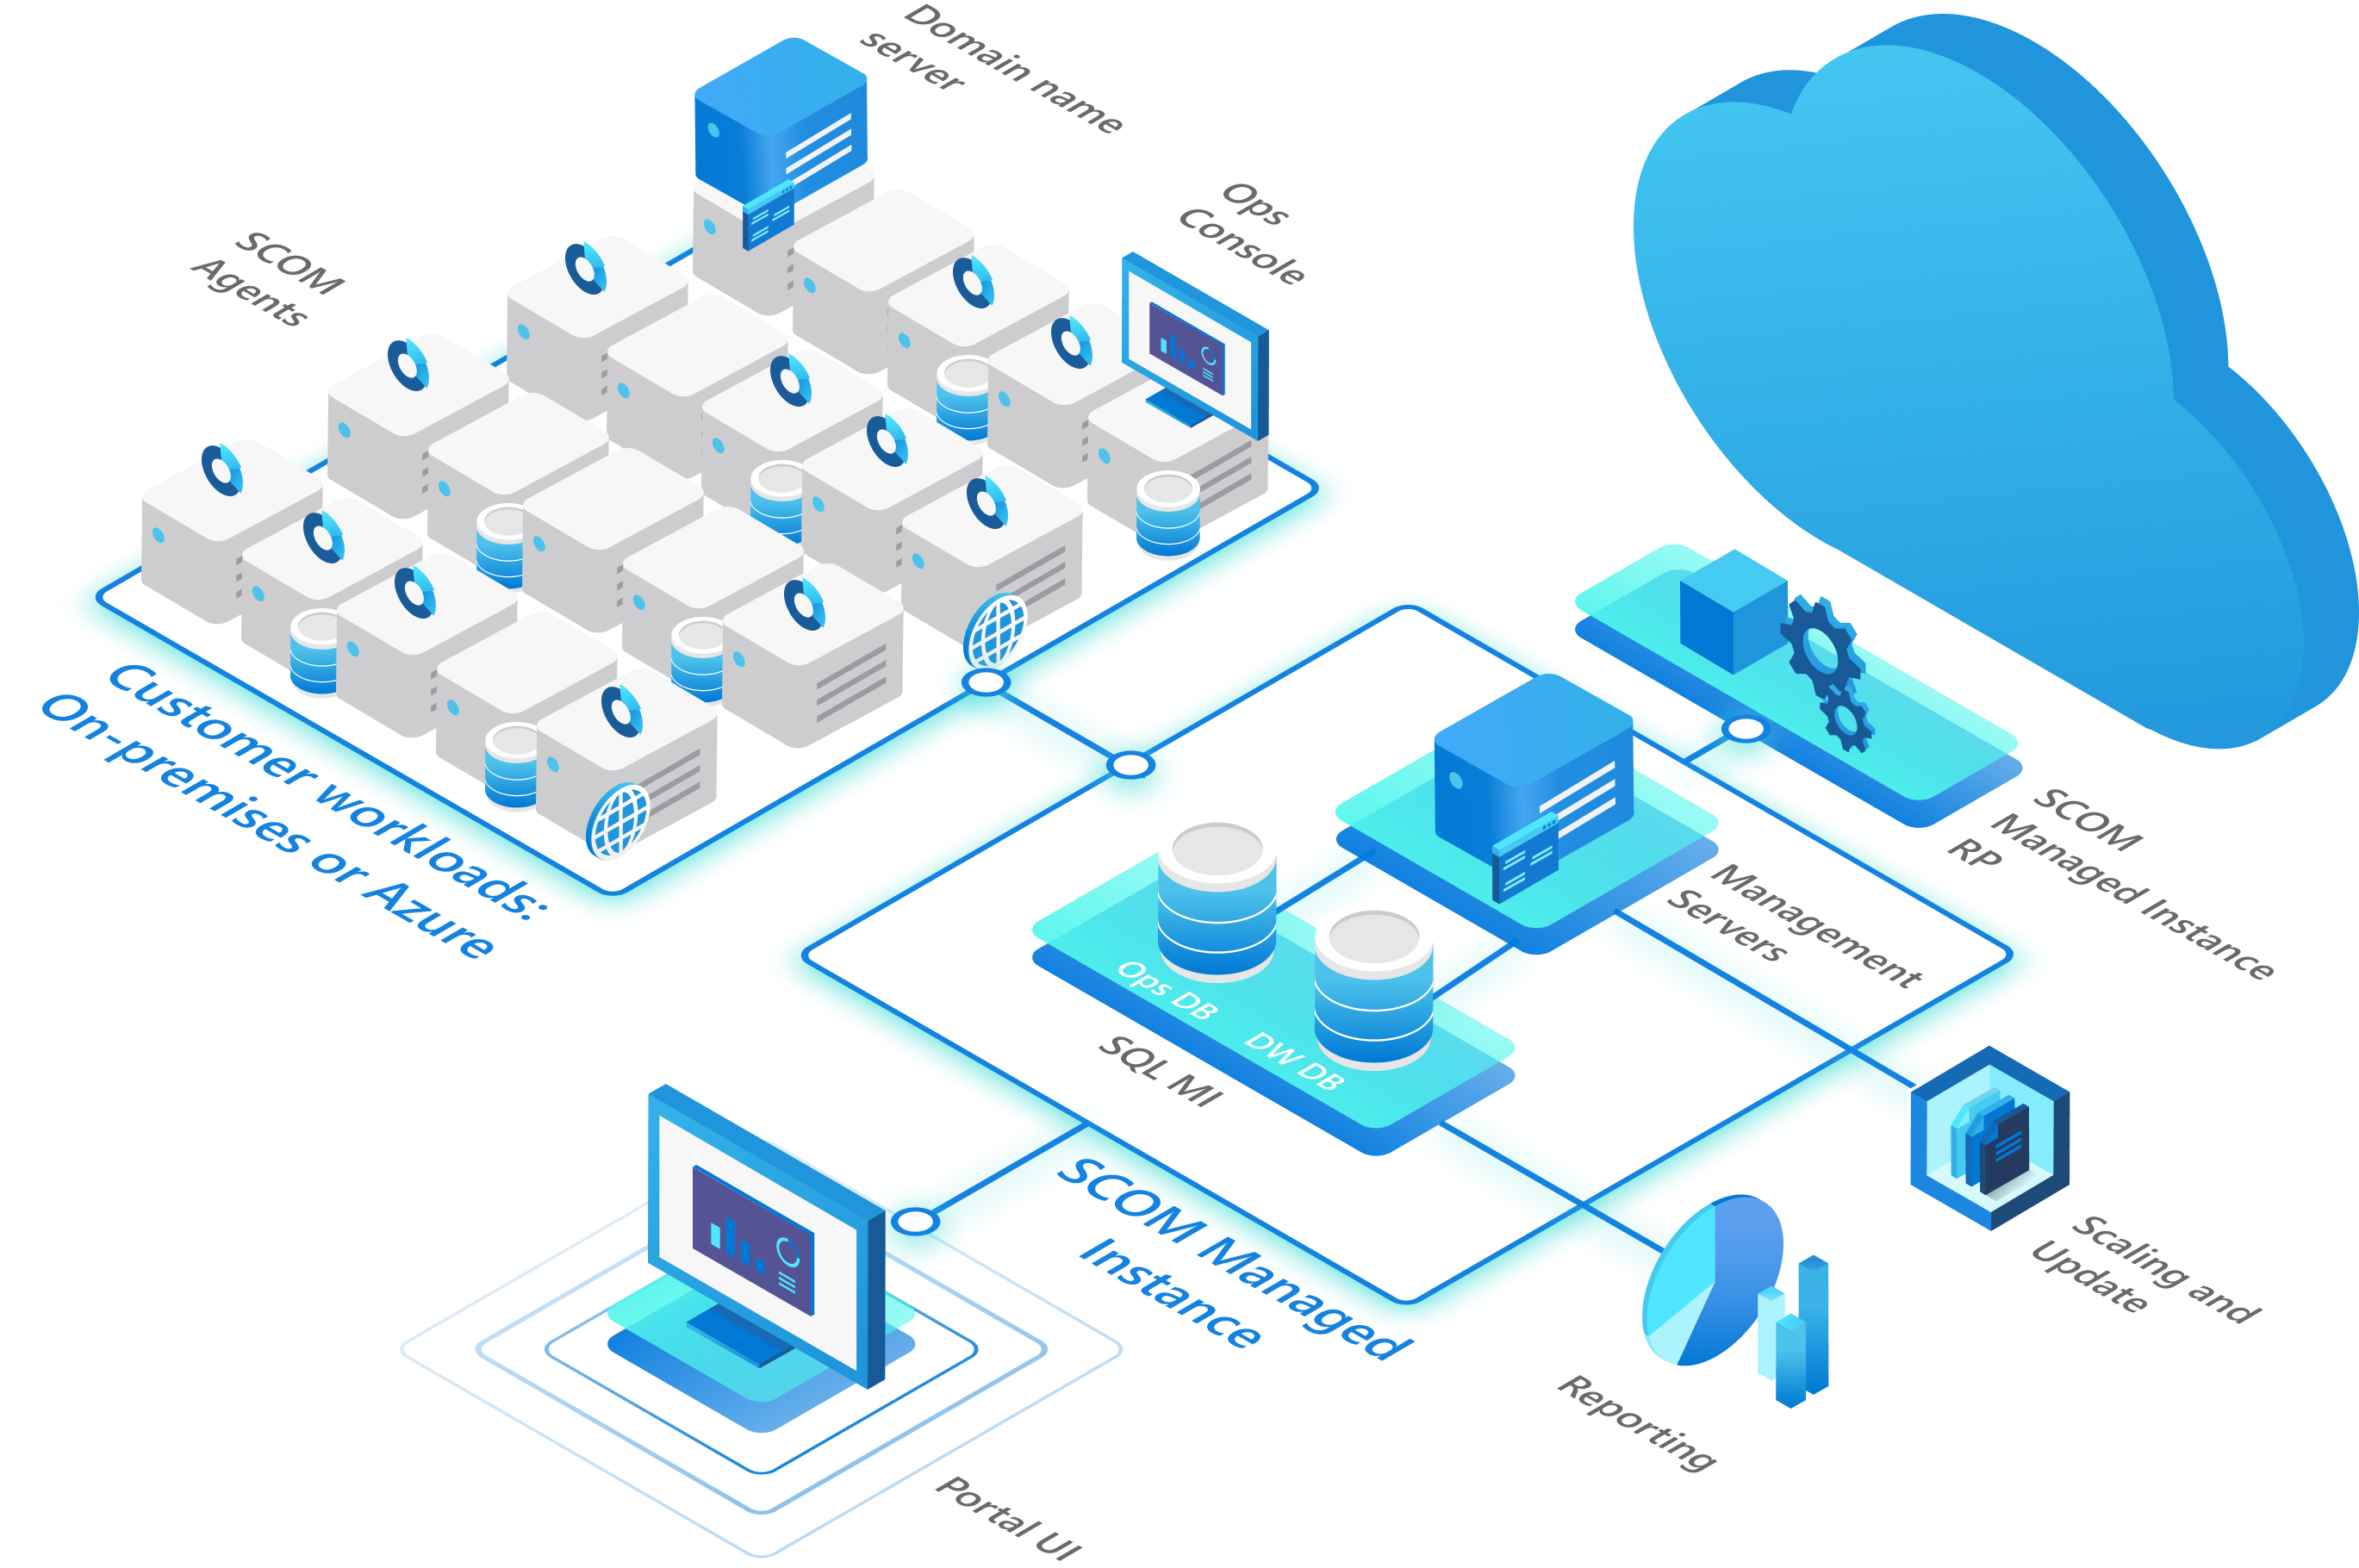
What is Azure Monitor SCOM Managed Instance
In practice, Microsoft is not launching a new product or new feature, but transforming a PaaS into a product that is still very important for several corporations.
The diagram below is available at About Azure Monitor SCOM Managed Instance (preview) | Microsoft Learn makes it very clear that the functionality is inverted where SCOM is now in the cloud monitoring the on-premise environment.
Factors to be considered
With this new feature we have to question whether or not it will be worth migrating to the managed environment and we can use these factors initially:
| Benefits | Disadvantages |
|
(1) So far not available in Preview (2) So far not supported, but allows the use of Gateway Server |
During the Microsoft Ignite After Party I had the opportunity to present new Purview features that were released in GA.
Here we cover 4 different features that have been released, GA or improved:
-
Data Classification – Trainable classifiers and Exact Data List (EDM)
-
Data Connectors – Connection with WhatsApp, Google, Workspace, ServiceNow and others
-
Communication Compliance – Feature to review potential threats of both DLP and abuse
-
Insider Risk Management – Already covered in other lectures, but allows you to detect suspicious activity in detail (https://www.marcelosincic.com.br/post/detectando-atividades-suspeitas-com-o-irm-inside-risk-management.aspx)
Durante o Microsoft Ignite After Party tive a oportunidade de apresentar novas funcionalidades do Purview que foram lançadas em GA.
Aqui abrangemos 4 diferentes funcionalidades que tiveram lançamento, GA ou melhorarias:
- Data Classification – Classificadores treináveis (Trainable classifiers) e Lista de Dados exatos (EDM)
- Data Connectors – Conexão com WhatsApp, Google, Workspace, ServiceNow e outros
- Communication Compliance – Recurso para fazer revisão de possiveis ameaças tanto de DLP quanto abusos
- Insider Risk Management – Já tratado em outras palestras, mas permite detectar atividades suspeitas em detalhes (https://www.marcelosincic.com.br/post/detectando-atividades-suspeitas-com-o-irm-inside-risk-management.aspx)
One feature that we tested in Private Preview and is now in GA is incident maintenance, which involves both deletion and creation.
Create and delete incidents in Microsoft Sentinel – Microsoft Tech Community
Incident Deletion
It may seem at first that deleting an incident in the SOC environment is a non-standard task, as it could be used to hide or improve a statistic (KPI) of the support team.
Despite an apparent contradiction, this feature is important because an incident is not always closed or dealt with. A common example is the Adaptive application that repeatedly responds to applications like Azure Arc itself or Automation.
In cases where the incident was not effective and not even a false positive because it has nothing to do with an effective security breach, deletion can be a useful feature instead of ignoring the alert. After all, one day a really suspicious application will run on the server and by ignoring the suspicious applications rule you won’t know.

As can be seen above, the feature is very visible and accessible.
Note : Incidents generated by integration with Microsoft 365 Defender cannot be deleted as they have been linked.
Important : In the SecurityIncident table, the incident and who deleted it will be recorded. There is no recycle bin to recover the incident, but the alerts and the incident itself remain recorded in the log tables and you will eventually be able to audit the deleted incidents to avoid improper manipulations.

Manual Incident Creation
This feature has been expected for a while and doesn’t need much explanation, after all we used custom alerts to create custom incidents. This was work, since it was necessary to identify a situation that could generate an incident but that was not mapped. For example a specific event that we generated manually and mapped an alert in KQL to create an incident of a specific case.
But that didn’t always work, for example let’s say that a user received a phishing in his personal email and opened it on the company computer and consequently was not detected by the MDE. In this case, we manually record the incident to be included in the SOC activities.
Another very common case is the activities of calling programs that could not be installed, activities that were barred and it was necessary to create some type of mitigation, etc. In these cases, the SOC had no way of recording these incidents, normally coming from the ticket system.
The process is very simple, you will use the incident creation button and enter all the necessary fields and then work with it as you do with the other incidents.

Now your SOC service dashboard will have a much better view, without the need to add more than one tool.
Detecting suspicious activity works with the behavior of users.This behavior is not limited to DLP, but covers:
- MPIP (formerly Microsoft Information Protection) Data Protection Rules
- MDE (Microsoft Defender Endpoint) Rules
- MDfC (Microsot Defender for Cloud Apps, formerly CASB) Rules
- Office 365 and Windows Activity Log
Once I capture this data I can create a baseline to detect:
- Unexpected behavior of a person in relation to their own activity in the last 30 to 90 days
- Unexpected behavior of an entity compared to the company-wide baseline
For this, triggers are created that can be activities such as a DLP rule, copying files to a flash drive, exfiltration via the web, etc.
I presented all these resources in the webcast with Thais Mafra. Watch and better understand this feature (pt-br)!
A simple and very functional feature of Sentinel in the integration with playbooks is delivery as a chat message in Teams.
The example below demonstrates how alerts are delivered to Teams with the details of the alert that was triggered.

Creating Logic Apps and Automation Rule
When Sentinel connectors are installed, a Logic Apps is automatically created for automation, without having tasks configured except for the first one, which is the incident trigger.
This will be the playbook that all enabled alerts are configured as the default response form.

When editing the playbook, enter the For each object that is the loop to enable multiple incidents to be triggered and not just the first one. This can happen in environments where a situation has created more than one incident and the lack of this loop would not trigger for all of the incidents.
Note that the For each loop reads the incident data and sends it to the email with the properties below for title, recipient and sent text.
In the case below, I deleted the default object that was email and replaced it with the Post message in a chat or channel object, which allows sending the message to both a single user and a Teams group or channel:

The next step is to create the trigger rule for the notification playbook in Sentinel.
See that the name is similar to my choice but you can use any other name, which will make it easier when relating the alerts to the automation call.

Enabling Analytical Rules for Submission in Teams
Go into Sentinel Analytics options , enable the rules you want to be alerted to and edit them.

In the rule options, you can edit the automation autoresponder that we created in the previous step so that the playbook is executed.

By editing the rules you can create new automation responses without having to create them first in Automation as I did before, although I think this can generate multiple orphan objects later.
But if you want to create a new response, you can click on the Add new button and name the automation and indicate which of the playbooks will be executed:

Okay, now you will receive incident details directly through the Teams channel or chat!
The concept of entity behavior is very important in an investigation or suspected misuse of rights or actions that indicate a failure or intrusion.
With Entity Behavior we can use an IP, hostname, resource name in Azure or a user’s account to check the history of what he has done over a period of time and identify harmful behavior.
Configuring the Entity Behavior
By clicking on Sentinel in the menu “Threat management –> Entity behavior” you will see the option “Entity behavior settings” where you will configure what you want to include in the search. See that in my example I selected the different auditing sources that I have enabled.

Note that you can use UEBA (User and Entity Behavior Analytics) which we will not cover here in this post, but it is a Sentinel feature for analyzing the analytical behavior of entities autonomously.
Running the research
The next step is to choose the entity or object that you will generate the data from. I’ll use my test user as an example:
Once you have selected what you are going to analyze, Sentinel will bring up the summary screen with the object data, a graph of actions, anomalies or potentially dangerous activities and a table with analyzes on the right side (Top Insights) such as groups and similar users, administrative actions performed such as account lockout, ceded privileges, SAP actions, anomalies, UEBA, therat indicators and watchlist.
In my example, see that in Top Insights a DLP rule was alerted as an activity that could be indicative of dangerous behavior.

Also, in the Overview frame you can see that a search operation detected by one of Sentinel’s analytic rules was performed. This rule detects active object listing operations, categorized in MITER as Initial Access.

Now using the Investigate button you will see an interesting panel with a summary of the actions performed by the user being analyzed.
Note that I have a breakdown by objects that were accessed or actions that generated certain behavior.

By clicking on most of them, you will not see a summary already analyzed as below, as they will have aggregated events and it will be necessary to open Log Analytics, like the screen below. In this case I opened one of the objects and asked for its details.
Just as a side note, I used the UEBA query to detect actions where I had previously had a high number of file deletion actions.
Conclusion
When an attempt or suspicion of misuse of privileges or erratic behavior occurs, the Entity behavior is the tool that will allow you to obtain quick insights from the aggregation of all Sentinel features.
It is certainly an excellent tool for day-to-day analysis and detection of threats that may not have generated a more serious incident or that we need to find a breaking point in behavior.
We always approach with customers the importance of monitoring in manufacturing environments. For this I always do demonstrations of Microsoft Defender for IoT and we show the number of unknown devices in an environment and how they often communicate directly with the internet.
But it’s not just shop floor and automation systems that can be a leakage problem in our environments. So we ask ourselves:
Am I really safe even though I’m not manufacturing and industrial automation?
The answer is no!!!
For example, recently a vulnerability in Mikrotik and in the past with Cisco and other products show that we can have smart equipment connected to the network hacked and used for data leakage or cyber attacks.
Alexa and Google Home are common even in the domestic environment, but in companies we have telephone exchanges, sophisticated video conferencing equipment, door opening, smart lights, air conditioning with wifi and energy sensors. That’s just citing the ones that many have in their homes!
In addition, many of these devices are from companies that we are not sure about security, for example Sonoff uses eWelink, Geonav or HI, LG or ThinQ and each manufacturer has a different platform that integrates with Home and Alexa without any type of security. sophisticated. It would be enough for me to hack one of these to do a remote reconnaissance and inventory.
How to protect myself?
Adopt solutions that track these devices. These solutions read protocols common to smart equipment as they use broadcast to be configured as is the case with Alexa and Google Home and wifi devices.
In the case of Microsoft Defender for Endpoint it detects BIOS changes, having a catalog of most industrial automation manufacturers (ABB, Siemmens and others) allowing it to be updated whenever important changes appear.
The print below is a dashboard of a scan in my house, where I have air conditioning, Google Home, smart lamps and energy sensors:


Microsoft Defender for IoT allows you to simulate situations between different devices to analyze whether direct or indirect communications occur between them, which are shown in the previous screenshot as red dots. Below is an example of this analysis:

Another analysis that is also performed by these solutions is the discovery and alert for new devices placed on the network. For example if an employee shows up with a wifi and connects to the network it will detect it instantly!
In addition, it is also important to know the protocols and ports that the devices use and their internet bandwidth consumption:

Finally, we can generate executive reports for detailed analysis and a safety score for what was inventoried:

Integration with Sentinel
Microsoft Sentinel already has a connector for Defender for IoT, but you can also integrate standalone systems such as SCADA directly, as well as allowing you to export logs to an external SIEM.
Stream Microsoft Defender for IoT alerts to a 3rd party SIEM
CONCLUSION
Even home environments already have many automations and in general they are software and providers that we don’t have complete trust.
The behavior of this equipment can be harmful and go unnoticed by the entire security team, so don’t miss out because you don’t have a factory environment!
